Overview
Utilize the analytics page on ParcelPanel to access detailed shipment data, including Shipments, Transit time, Tracking page, and Shipping notifications. Various data analyses provide insights to optimize channels and gauge ParcelPanel's performance.
Navigation
Navigate to the Analytics page in the ParcelPanel Admin. You can switch between different data pages, including Shipments, Transit Time, Tracking Page, and Shipping Notifications, from the menu at the top.

Export PDF
Click to export the current page to a PDF file based on your applied filters.

Time Statistics
The statistics in this section are based on the time zone set for your current store.
Custom Filters
You can customize data filtering using the Time Selector, Courier, and Destination dropdown options.
Data Definitions and Calculation Logic
Note: All statistics in this page are based on delivered shipments.
P85 Transit Time (d)
Definition: The 85th percentile is the value below which 85% of the data falls. This means that 85% of the data values are less than or equal to this value, while the remaining 15% are greater.
Calculation:
1. Sort the N values from smallest to largest.
2. Determine the position of the 85th percentile, which is N × 0.85.
3. If the position is an integer, take the average of the values at this position and the next. If the position is not an integer, round up to the nearest whole number and take the value at that position.
Average Transit Time (d)
Definition: The average value of transit times.

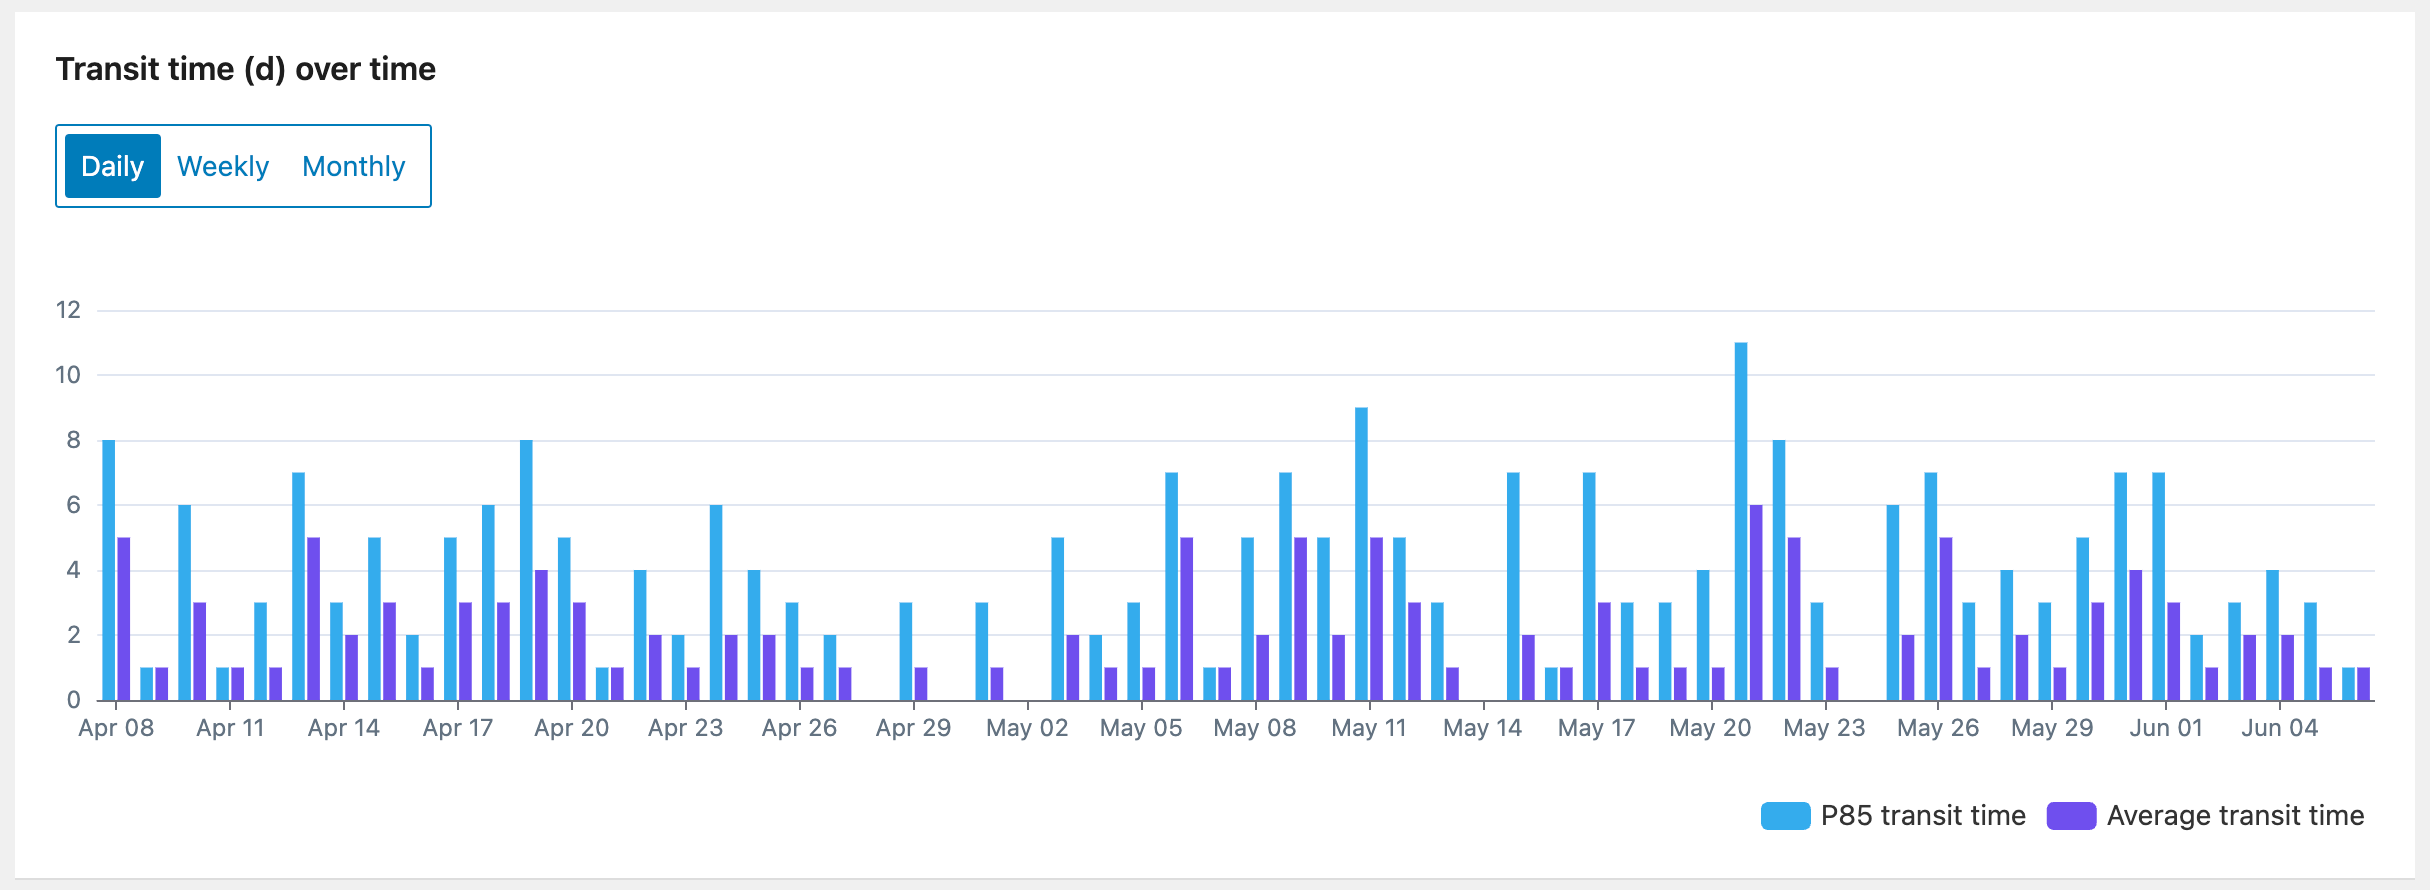
Transit Time (d) Over Time Dual Bar Chart
Daily / Weekly / Monthly: Displays a dual bar chart of P85 transit time and average transit time based on different time intervals.

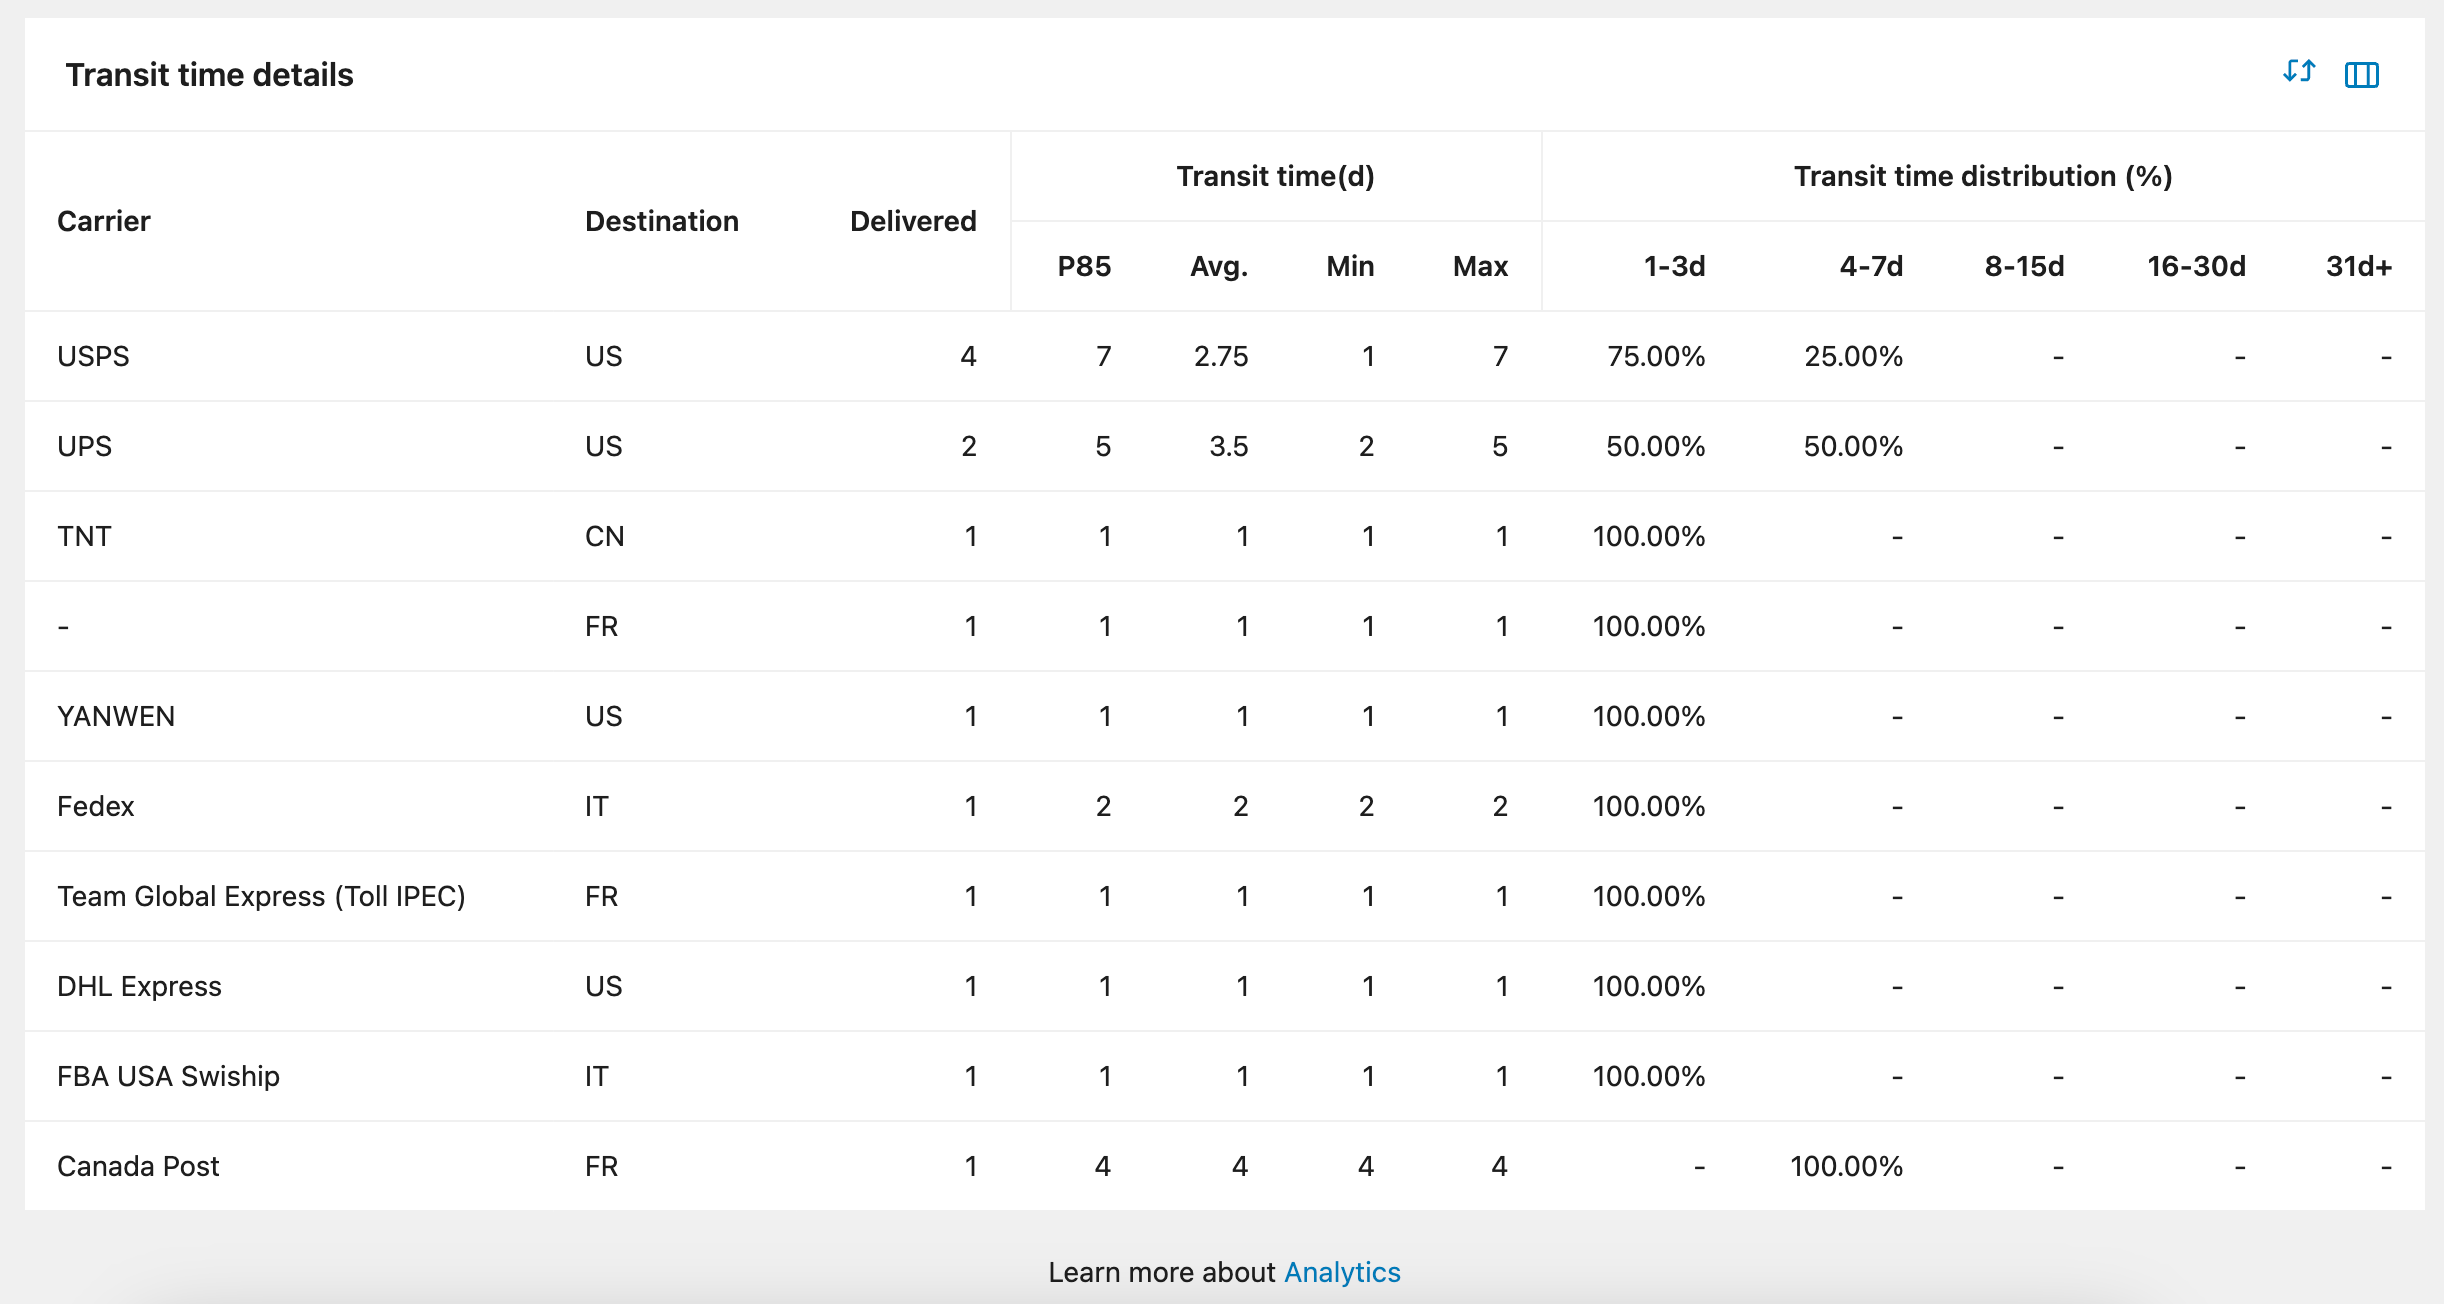
Transit Time Details Table
- You can use the Sort button to sort by Carrier, Destination, or Delivered (Delivered shipments).

- You can use the Columns button to edit the columns you want to display.

Column Definitions
Carrier: The carrier.
Destination: The destination.
Delivered: The number of delivered shipments.
Transit Time (d):
- P85: P85 transit time.
- Avg.: Average transit time.
- Min: Minimum transit time.
- Max: Maximum transit time.
Transit Time Distribution (%)
- 1-3d: Percentage of shipments with a transit time of 1-3 days.
- 4-7d: Percentage of shipments with a transit time of 4-7 days.
- 8-15d: Percentage of shipments with a transit time of 8-15 days.
- 16-30d: Percentage of shipments with a transit time of 16-30 days.
- 31d+: Percentage of shipments with a transit time of 31 days or more.

Need help? Feel free to contact us via online chat or email, our world-class 24/7 support team is always here 🌻.
